| |
|
 |
|
| European Union |
|
|
|
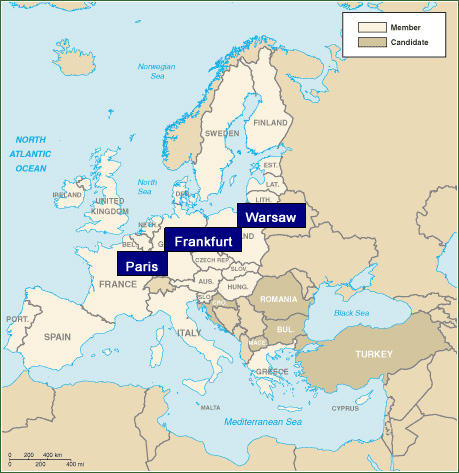
Significant Growth Chances caused by Enlagement and Unification
The European Union has the largest economy in the world. The EU economy is expected to grow further over the next decade as more countries join the union - especially considering that the new States are usually poorer than the EU average, and hence the expected fast GDP growth will help achieve the dynamic of the united Europe.
Domestically, the European Union attempts to lower trade barriers, adopt a common currency, and move toward convergence of living standards. Internationally, the EU aims to bolster Europe's trade position and its political and economic power. Because of the great differences in per capita income (from $15,000 to $56,000) and historic national animosities, the European Community faces difficulties in devising and enforcing common policies. However, the market is on the path to a unified market currency, labor, law), it’s excellent logistic and business infrastructure will attract a vast majority of foreign direct investment |
| |
| Market Comparison of EU with the US |
| Country |
GDP ($ Bil.) |
Pop. ($ Bil.) |
| Germany |
2,026 |
82.3 |
| U.K. |
1,506 |
59.9 |
| France |
1,395 |
59.0 |
| Italy |
1,168 |
57.8 |
| Spain |
618 |
40.1 |
| EU(15) |
8,456 |
378.0 |
| US |
9,081 |
282.4 |
|
| Pharma Sales $ Growth across Europe by value |
| Country |
total market |
|
domestic brand |
|
| |
value |
growth |
value |
growth |
| |
Bill Euro |
2003-2004 |
Bill Euro |
2003-2004 |
| Germany |
20.1 |
5.5% |
12.8 |
4.4% |
| UK |
12.1 |
10.0% |
9.2 |
5.6% |
| France |
16.8 |
6.2% |
13.8 |
4.9% |
| Netherlands |
3 |
4.5% |
2.2 |
3.3% |
| Spain |
8 |
9.7% |
7.1 |
9.1% |
| Italy |
11.6 |
4.5% |
10.2 |
4.4% |
| Portugal |
2.1 |
8.4% |
1.8 |
5.7% |
| Belgium |
2.5 |
7.4% |
2.3 |
6.1% |
| Austria |
1.6 |
5.7% |
1.4 |
4.7% |
| Norway |
1 |
4.1% |
0.9 |
2.9% |
| Czech R |
0.8 |
10.5% |
0.7 |
11.7% |
| Ireland |
0.9 |
17.5% |
0.8 |
17.8% |
| Total |
80.5 |
6.8% |
63.1 |
5.5% |
|
|
| |
Example Pharmaceutical Business
Europe remains an attractive market to launch pharmaceutical products in because centralized regulatory ruling allows for immediate access to 15 member states. Although EU expansion to 25 countries does offer even greater market opportunities, the timely implementation of harmonized regulatory and intellectual property laws within these accession countries remains the limiting factor for success. |
| |
| Siegle, Hu & Partners already gathered significant insight into Europe’s pharmaceutical business: |
-
Impact of EU drug authorization, pricing, reimbursement, parallel trade and generics post-accession
-
Framework for market entry, including an optimal country-by-country product launch sequence for the EU15 states
-
Evaluated current issues and changes impacting pricing and reimbursement within each EU15 member state
-
Benchmarked the current market entry practices used across Europe in terms of either the partnering or go-it-alone routes
|
 |
| |
| Siegle, Hu & Partners – European Offices |
 |
Siegle, Hu & Partners International provide clients with the expertise to define key success factors when entering the European marketplace, including:
|
|
|
Our team is managed as a single practice to provide seamless service to clients
All consultants with academic credentials and substantial experience on different European markets and cultures |
| |
 TOP TOP |
|
|